iPhone tide returns, Services tops $100B.
Apple FY2025 (ended 2025-09-27) revenue reached $416.2B, up 6.4% YoY; the Services segment crossed $109.2B for the first time (+14%) and rose to 26% of total revenue, becoming a structural anchor for group-level gross margin. Q1 FY2026 extended the iPhone 17 + Apple Intelligence-driven upgrade cycle, with revenue up 15.7% YoY and net income hitting an all-time high of $42.0B. This report draws on the three most recent SEC filings — FY2025 10-K, Q1 FY2026 10-Q, Q3 FY2025 10-Q — across four dimensions: products, geography, profitability, and shareholder returns.
Quick numbers
| Item | Value |
|---|---|
| Ticker | NASDAQ : AAPL |
| CIK | 0000320193 |
| FY25 Revenue | $416.16B (+6.4%) |
| Net income | $112.01B (+19.5%) |
| Q1 FY26 Revenue | $143.76B (+15.7%) |
| Cash + securities | $144.8B |
§01 · Key Metrics — the year at a glance
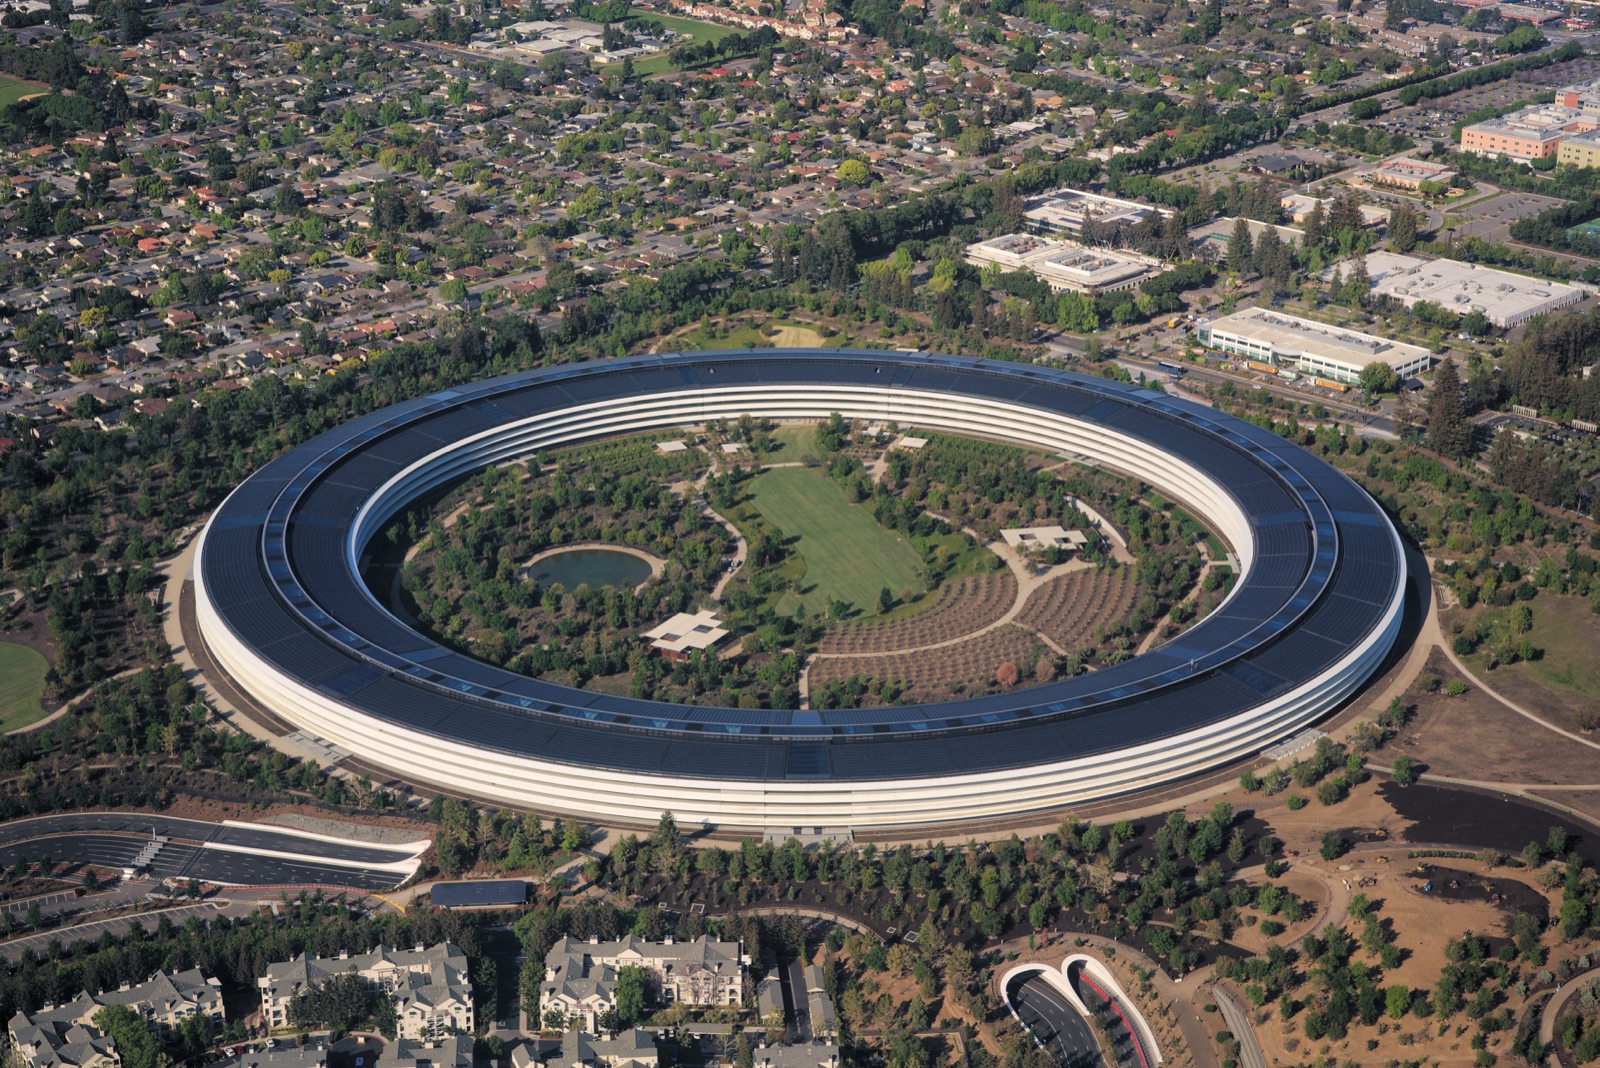
Image: Wikimedia Commons (Daniel L. Lu / dllu) · CC BY-SA 4.0.
| KPI | Value | Notes |
|---|---|---|
| FY2025 Revenue | $416.2B · YoY +6.4% | FY2024: $391.0B · FY2023: $383.3B |
| FY2025 Net income | $112.0B · YoY +19.5% | Diluted EPS $7.46 vs FY24 $6.08 |
| Operating income | $133.1B · YoY +8.0% | Operating margin 32.0% (FY24 31.5%) |
| FY25 Free cash flow | $98.8B · YoY -9.3% | OCF $111.5B − Capex $12.7B |
| Cash + marketable securities | $132.4B · vs FY24 -15.4% | Q1 FY26 has rebounded to $144.8B |
| Services revenue | $109.2B · YoY +14% | Services gross margin 75.4% (FY24 73.9%) |
| Blended gross margin | 46.9% · +0.7 pts | Products 36.8% · Services 75.4% |
| FY25 Shareholder returns | $106.1B · Buybacks $90.7B + dividends $15.4B | Diluted shares 15.05B (-2.7% YoY) |
FY2025 was a “refueling year” for Apple’s cash machine. Services profit alone exceeds $82B — comparable to a hyperscale SaaS franchise — while in Q1 FY26 the iPhone 17 family drove a strong hardware return (+23% YoY); paired with Apple Intelligence and the visual / spatial computing roadmap, this constitutes a new dual pillar for the growth story. At the same time, the company returned more than $100B to shareholders in a single year via buybacks and dividends, sustaining the most aggressive capital-return cadence on the planet.
— Synthesis of 10-K / 10-Q disclosures; data not independently audited
§02 · Business — how the $416B is split
Revenue mix · product matrix
iPhone remains the single largest category ($209.6B, 50.4%); Services rises to $109.2B (26.2%); Wearables shows its first YoY decline (-4%), consistent with a soft Watch cycle; Mac/iPad re-accelerated on M4 silicon and refreshed lineups.
Geographic mix · five operating segments
Americas still dominates ($178.4B, 43%); Greater China declined another 4% to $64.4B in FY25, but rebounded sharply +38% in Q1 FY26 on iPhone 17 Pro; Europe +10%, Japan +15%, Rest of Asia Pacific +10% — a broad-based expansion.
Services · annual growth
Services has compounded at a steady 13–14% for four years, climbing from $78B in FY22 to $109B in FY25; the mix sits behind App Store take, Apple Music / TV+ / Arcade subscriptions, iCloud, AppleCare, advertising (search + News), and Pay/Card financial services.
Products vs Services · gross margin
Services gross margin rose from 70.8% in FY23 to 75.4% in FY25; the rising share of high-margin businesses is the core driver of the blended gross margin’s continued expansion. Products gross margin slipped slightly to 36.8% on tariffs and product mix.
Quarterly revenue & YoY growth
§03 · P&L — operating leverage intact
Income statement (quarterly + FY)
Per SEC disclosure · USD millions.
| Item | Q3 FY25 | Q4 FY25* | Q1 FY26 | FY 25 | FY 24 |
|---|---|---|---|---|---|
| Revenue | 94,036 | 102,466 | 143,756 | 416,161 | 391,035 |
| › Products | 66,613 | 73,730 | 113,743 | 306,928 | 294,866 |
| › Services | 27,423 | 28,750 | 30,013 | 109,158 | 96,169 |
| Cost of revenue | 50,318 | 54,125 | 74,525 | 220,960 | 210,352 |
| R&D | 8,603 | 8,174 | 10,887 | 34,550 | 31,370 |
| SG&A | 6,913 | 6,740 | 7,492 | 27,601 | 26,097 |
| Operating income | 28,202 | 32,427 | 50,852 | 133,050 | 123,216 |
| Net income | 23,434 | 27,466 | 42,097 | 112,010 | 93,736 |
| Diluted EPS | $1.57 | $1.84 | $2.84 | $7.46 | $6.08 |
| Gross margin | 46.5% | 47.2% | 48.2% | 46.9% | 46.2% |
| Operating margin | 30.0% | 31.7% | 35.4% | 32.0% | 31.5% |
* Q4 FY25 derived from FY25 less 9M FY25 (Q3 10-Q); not separately disclosed. Apple does not split quarterly R&D and SG&A line items; figures shown are by-period disclosure minus subtraction.
Margin trajectory
Q1 FY26 operating margin reached 35.4%, a three-year single-quarter high; driven by a higher Services share, a richer iPhone Pro mix, and operating leverage on opex.
§04 · Balance — the capital return machine
Three-period balance sheet comparison
2025-06-28 · 2025-09-27 · 2025-12-27 · USD millions.
| Item | Q3 FY25 | FY25 | Q1 FY26 |
|---|---|---|---|
| Cash & equivalents | 36,269 | 35,934 | 45,317 |
| Marketable securities (current) | 19,103 | 18,763 | 21,590 |
| Accounts receivable | 27,557 | 39,777 | 39,921 |
| Inventory | 5,925 | 5,718 | 5,875 |
| Total current assets | 122,491 | 147,957 | 158,104 |
| Marketable securities (non-current) | 77,614 | 77,723 | 77,888 |
| Property & equipment, net | 48,508 | 49,834 | 50,159 |
| Total assets | 331,495 | 359,241 | 379,297 |
| Current liabilities | 141,120 | 165,631 | 162,367 |
| Long-term debt | 87,430 | 78,328 | 76,685 |
| Total liabilities | 265,665 | 285,508 | 291,107 |
| Stockholders’ equity | 65,830 | 73,733 | 88,190 |
| Accumulated deficit | (17,607) | (14,264) | (2,177) |
| Shares outstanding (thousands) | 14,856,722 | 14,773,260 | 14,702,703 |
Cash + marketable securities · stack
Apple maintains a liquid pool around $145B. The company also carries roughly $88B of long-dated bonds (weighted rate ~3.8%) while holding $78B of non-current securities — a textbook “self-arbitrage” balance sheet, funding short, low-coupon debt against a longer-duration yield portfolio.
Capital structure · single-class
$0.00001 par · no Class A/B split. As of 2025-12-27, 14,702,703 thousand common shares outstanding · 1 share, 1 vote.
| Class | Shares | Voting share |
|---|---|---|
| Common Stock (1 vote) | 14.70B | 100% |
Unlike Google/Meta/Reddit, Apple’s capital structure is fully one-share-one-vote — neither founders nor management hold any super-voting stock. Cumulative buybacks of more than 800 million shares over the past decade (on a retired basis) have driven shares outstanding from a peak of ~26B in FY12 down to 14.7B today — almost doubling the value behind each share.
Assets vs liabilities · structure
§05 · Cash Flow — where the cash goes
OCF / FCF / shareholder returns
Cash flow takeaways
- OCF still ~1.0× net income. FY25 OCF was $111.5B, almost matching $112.0B of net income; cash conversion is at the limit. Q1 FY26 alone delivered OCF of $53.9B (+80% YoY).
- Capex stepped up to $12.7B. FY25 Capex of $12.7B (3.1% of revenue) was a meaningful expansion from FY24’s $9.4B; spend skewed to data centers, AI infrastructure, and supply-chain diversification (India, Vietnam).
- Buybacks $90.7B + dividends $15.4B. FY25 shareholder returns totaled $106.1B, near 100% of FCF; diluted shares fell from 15.35B to 14.95B (-2.6%).
- SBC expense $12.9B. Stock-based comp was 3.1% of revenue, well below large-cap tech peers (typical SaaS at 8–15%); essentially fully absorbed by buybacks, with no dilution risk.
§06 · Leadership — who’s running this
Named Executive Officers
The following are the named executives identified from the FY2025 10-K (filed 2025-10-31) signature page and public appointment materials. Two material personnel changes during the period: on 2025-07-01 Sabih Khan succeeded Jeff Williams as COO; on 2026-01-01 Ben Borders succeeded Chris Kondo as Principal Accounting Officer. Luca Maestri handed the CFO role to Kevan Parekh in early 2025.
| Role | Name | Notes |
|---|---|---|
| CEO | Timothy D. Cook | Chief Executive Officer · Director. Joined Apple in 1998 and became CEO in 2011. During his tenure Apple crossed $3T market cap and joined the $4T club for the first time. Architect of the Services strategy and the rebuild of the global supply chain (capacity expansion in India and Vietnam). |
| CFO · NEW | Kevan Parekh | Senior Vice President, Chief Financial Officer. Took over from Luca Maestri as CFO in January 2025 (Maestri moved to Vice President, Corporate Services). More than 12 years at Apple, previously head of FP&A and regional finance. First to sign the FY25 10-K as CFO. |
| COO · NEW | Sabih Khan | Senior Vice President, Chief Operating Officer. Succeeded Jeff Williams as COO on 2025-07-01. Joined Apple’s supply-chain team in 1995 and has led global operations, logistics, and procurement for nearly a decade. Seen as the lead decision-maker on tariffs and supply-chain diversification. |
| General Counsel | Katherine L. Adams | Senior Vice President, General Counsel and Secretary. Joined Apple in 2017 to lead global legal, compliance, antitrust litigation, and regulatory affairs. Drove the Epic / App Store litigations and EU DMA compliance — the key guardian of Services’ long-term sustainability. |
Executive change log
FY2025 – Q1 FY2026 · 10-Q / 10-K / 8-K disclosures.
- 2025-01. Kevan Parekh succeeds as CFO; Luca Maestri moves to Vice President, Corporate Services.
- 2025-07-01. Sabih Khan becomes COO; Jeff Williams (29-year tenure) transitions into retirement.
- 2025-10-31. FY2025 10-K signed; Chris Kondo announces a 2026-01-01 role transition.
- 2026-01-01. Ben Borders becomes Principal Accounting Officer, reporting to CFO Parekh.
- Continuity. CEO, GC, retail/HR leadership unchanged; the core decision layer transitions smoothly.
Board of Directors
8 directors · 2025-10-31 10-K signature page.
| Director | Role |
|---|---|
| Timothy D. Cook | CEO · Director |
| Arthur D. Levinson | Chair · Indep |
| Wanda Austin | Independent |
| Alex Gorsky | Independent |
| Andrea Jung | Independent |
| Monica Lozano | Independent |
| Ronald D. Sugar | Independent |
| Susan L. Wagner | Independent |
Apple is the textbook broadly held public company — single-class common stock, one vote per share, no controlling holder or special voting agreements. Independent directors are 7 of 8 (Cook the sole executive director). Auditor is Ernst & Young LLP (PCAOB Firm ID 42).
§07 · Risk — what could derail this
- Supply-chain & geopolitical concentration. The vast majority of finished products are assembled by outsourced partners in mainland China, India, Vietnam, and elsewhere; tariffs, export controls, and geopolitical conflict (explicitly cited in the 10-K) can directly raise costs or cause stock-outs. New tariff pressure already showed up in FY25 Products gross margin.
- Greater China sales volatility. Greater China FY25 revenue of $64.4B was down 4% YoY at 15.5% of group; pressured by domestic-brand competition, soft consumer demand, and regulatory friction. Despite the +38% Q1 FY26 rebound on iPhone 17 Pro, the structural regional risk remains.
- App Store and antitrust regulation. Within Services, the App Store take rate is the high-margin core; the EU DMA, the US Epic ruling, and alternative-payment rules in Korea/Japan have rolled in successively. Any forced change to take rates or distribution would pressure the 75% Services gross margin.
- New-product cycle and AI cadence. The phased rollout of Apple Intelligence, the adoption pace of Vision Pro / Vision Air, and the magnitude of innovation in the next iPhone/Watch generations directly drive the upgrade cycle; any slip or feature gap (especially on-device LLM) could weaken trade-in willingness.
- FX and macro sensitivity. International revenue was 57% of FY25 total; a stronger dollar compresses both nominal revenue and gross margin. The 10-K notes documented FX headwinds across Americas, Japan, and other segments. Beyond that, a global slowdown and a softer consumer-electronics cycle remain macro tail risks.
Bottom line · Structural story: the hardware cycle is back, and Services never left.
In FY2025 Apple won on two fronts simultaneously: (a) iPhone restarted high-end upgrades on the back of Apple Intelligence; (b) Services crossed the $100B annual mark while still growing 14%. Pricing for the next 1–2 years hinges on:
- Whether iPhone 17 / 18 can sustain Pro-tier mix
- Whether Services can keep 13%+ compounding
- Whether Greater China can return to +5% or better in FY26
- The global regulatory evolution of App Store take rates
- Whether the Vision lineup becomes a fourth growth pillar
“$145B liquid asset pool · $106B annual shareholder return · 14.7B shares and falling” — Apple is still the global benchmark for the capital-return machine.
§08 · Valuation — valuation in context
AAPL current valuation
Data as of 2026-04-20 · close.
| Metric | Value |
|---|---|
| Price | $270.23 |
| Market cap | $3.80T |
| P/E (TTM) | 34.1× |
| P/S (TTM) | 8.7× |
| EV/EBITDA | 25.6× |
| FCF Yield | 2.6% |
| 52W range | $189.81–$288.62 |
Peer benchmark
Mega-cap TTM · latest.
| Ticker | Price | Mkt cap | P/E | P/S | EV/EBITDA | FCF Yield |
|---|---|---|---|---|---|---|
| AAPL | $270.23 | $3.80T | 34.1× | 8.7× | 25.6× | 2.6% |
| MSFT | $422.34 | $3.14T | 26.5× | 10.3× | 18.1× | 2.2% |
| GOOGL | $341.68 | $4.11T | 31.3× | 10.2× | 27.1× | 1.9% |
| NVDA | $200.98 | $4.96T | 40.5× | 21.4× | 36.4× | 1.7% |
Among the four Mega-caps, Apple shows a “middle-defensive” valuation profile: a 34× P/E sits slightly above MSFT (26.5×) and GOOGL (31.3×), reflecting the market’s willingness to pay a premium for stable cash flow, capital-return discipline, and brand power; but versus NVDA’s 40× P/E, 21× P/S, and 36× EV/EBITDA, AAPL still shows a clear growth discount — a function of its hardware base and single-digit revenue growth. EV/EBITDA of 25.6× tracks GOOGL and is well above MSFT’s 18×, primarily because the Services mix shift has lifted long-run margin expectations. Worth noting: a 2.6% FCF Yield looks unimpressive on its face, but does not reflect Apple returning essentially 100% of FCF as buybacks + dividends each year — under a “total return” lens (annual $106B shareholder return / $3.8T market cap ≈ 2.8%), plus the steady -2.7% share-count shrink, total shareholder yield is materially higher than the dividend yield alone.